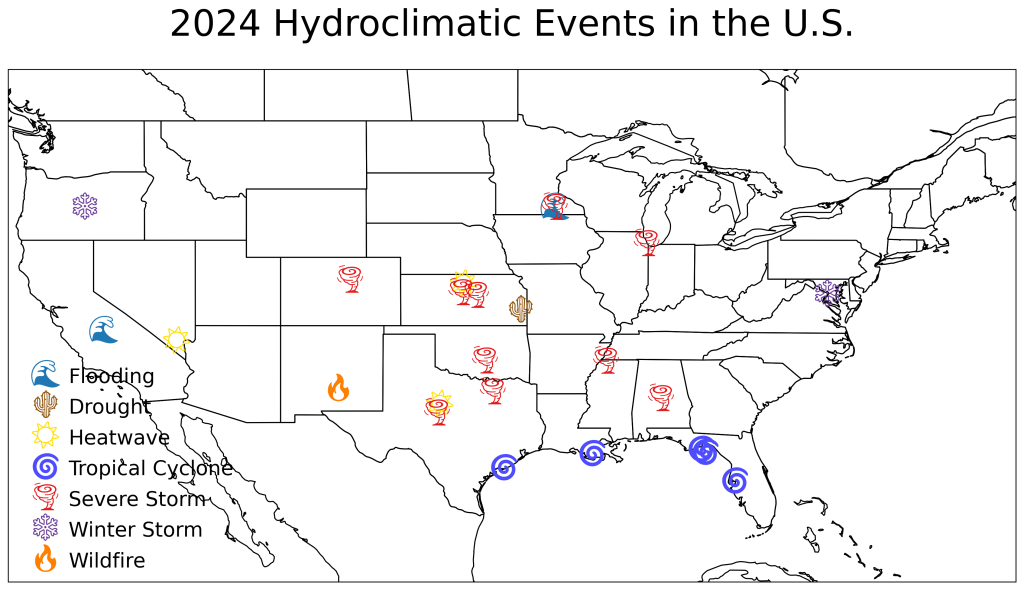
In 2024, the United States confronted an extraordinary—and costly—array of hydroclimatic disasters. Across different corners of the country, communities faced floods, droughts, heatwaves, hurricanes, tornado outbreaks, winter storms, and wildfires. In total, 27 separate events each inflicted at least $1 billion in damages, resulting in $182.1 billion in losses and 568 lives lost.
Torrential Floods and Lingering Drought
California Atmospheric Rivers, Feb 4–7
Two successive “atmospheric rivers” drenched California, delivering rainfall volumes typical of a full season in just days. Rivers overtopped their banks, roads became impassable, and power grids faltered—underscoring the vulnerability of urban and rural infrastructure alike.
Nationwide Drought & Heat, Jan 1–Dec 31
From the Rio Grande to the Columbia Gorge, 2024’s drought stretched coast to coast. Persistent deficits in soil moisture and streamflow stressed agriculture and municipal water systems. Compounding the crisis, record-breaking heat waves claimed over 100 lives, illustrating the lethal synergy of heat and aridity.
Unrelenting Heatwaves
Late June “Heat Dome”
A sprawling high-pressure ridge enveloped more than 100 million Americans in heat alerts. Major metropolitan centers—from Washington, D.C., to Philadelphia—recorded near-triple-digit highs; some locales saw heat indices surpass 105 °F.
Mid-July Coast-to-Coast Searing
By mid-July, 245 million people endured temperatures above 90 °F. Las Vegas smashed its all-time record at 120 °F, straining energy grids and prompting widespread heat-related advisories.
Late-August Plains Heat
Even as summer’s calendar waned, the Plains blistered. Abilene, TX, hit 113 °F; Medicine Lodge, KS, reached 115 °F—late-season extremes that challenged conventional “heat season” definitions.
The 2024 Hurricane Season: Cataclysmic and Costly
- Beryl (Jul 8) — A late-June Category 5 over the Atlantic weakened to Category 1 at landfall near Matagorda Bay, TX. Tornadoes, storm surge, and wind damage left towns in shambles.
- Debby (Aug 5–9) — Florida’s Big Bend bore the brunt of Category 1 winds before torrential rains spread flooding as far north as New York.
- Francine (Sep 11–12) — Striking Louisiana as a Category 2, Francine delivered coastal flooding and powerful inland rain bands into Alabama and Georgia.
- Helene (Sep 26–29) — One of the deadliest U.S. hurricanes since 2005, Helene made landfall as a Category 4 in Florida’s Big Bend, causing catastrophic flooding through North Carolina and Virginia.
- Milton (Oct 9–10) — Closing the season, Milton walloped the Tampa Bay area as a Category 3, spawning tornadoes and sending storm surges inland.
Collectively, these storms accounted for $125.3 billion in damages and nearly 340 fatalities, illustrating the growing expense—and human toll—of coastal hazards.
Tornadoes, Derechos, and Hail Outbreaks
- January 8–9 — Winter Tornado Outbreak
Thirty-nine twisters tore through Gulf Coast states in a rare winter event, causing $2.8 billion in damage. - Spring Multi-Day Outbreaks (Mar–May)
A succession of outbreaks produced more than 500 tornadoes from the Plains to the Southeast. Highlights included a record 27 tornadoes in the Chicago metro on July 15 and a May 6–9 outbreak that spawned over 160 twisters, some reaching EF-4 strength. Total losses approached $26 billion. - May 16–17 — Southern Derecho
Uncommon for the region, a derecho with 100+ mph winds raced from Texas to Florida, toppling trees and power lines at a cost of $1.6 billion. - Hailstorms in Colorado and Texas
Golfball- to softball-sized hail pounded cities, inflicting more than $5.4 billion in combined agricultural and property damage.
Winter’s Double Threat
- Pacific Northwest Ice Storm (Jan 12–15)
Freezing rain downed power poles from Portland to Seattle, leaving tens of thousands without heat in subfreezing temperatures. - Nationwide “Heather” (Jan 13–16)
A broad low-pressure system delivered heavy snow in the Northeast, ice in the South, and arctic outbreaks that cut power to over 200,000 homes.
Together, these events inflicted over $3.7 billion in losses and more than 60 fatalities, emphasizing that winter hazards span climate zones.
Wildfires Beyond the West Coast
New Mexico’s South Fork Fire (Jun 17–Jul 7)
Driven by extreme heat and gusty winds, the blaze near Ruidoso destroyed more than 1,000 homes. With a $1.8 billion price tag, it underscores how fire risk now extends well beyond California’s hillsides.
What 2024 Tells Us
Taken together, 2024’s billion-dollar disasters—27 in all—cost Americans $182 billion and claimed 568 lives. The breadth and intensity of these events illustrate:
- Compound Extremes: Drought bred heat waves; post-drought storms delivered devastating floods.
- Seasonal Creep: Tornadoes in January, heat waves in October—extreme weather calendars are stretching.
- Geographic Shifts: Wildfires in New Mexico; ice storms in Virginia; floods from coast to coast—no region is untouched.
As communities rebuild, one message rings clear: resilience and proactive adaptation are no longer optional. From bolstering power grids and updating flood maps to expanding cooling centers and improving early warning systems, our policy responses must evolve as fast as the climate itself.
Looking Ahead
While forecasting a single season’s storms remains challenging, climate projections point toward increasing frequency and severity of extreme events. By learning from 2024’s disasters—tracking their patterns, understanding their drivers, and investing in preparedness—we can hope to weather tomorrow’s storms with greater confidence.
Stay informed. Stay prepared. And let’s build a safer, more resilient future together.
Source: Billion-Dollar Weather and Climate Disasters. https://www.ncei.noaa.gov/access/billions/state-summary/US
Leave a Reply